When a phishing detection model flags an email, the SOC analyst staring at it needs to know why. A confidence score of 0.94 is not enough. They need to see which signals triggered the alert so they can make a fast decision, explain it to their team, and fine-tune the system over time.
That is where interpretability becomes essential — not as an academic exercise, but as a practical requirement for any detection tool that humans have to trust and act on.
Random Forest is a strong fit for this kind of work. It handles mixed feature types well, naturally produces feature importance rankings, and strikes a useful balance between predictive power and transparency. It is not the flashiest model, but for phishing detection in operational environments, it is often the most practical one to start with.
Interpretable Random Forest for phishing detection
This framework walks through building an explainable phishing detection pipeline that supports analysts rather than trying to replace them.
1) Why explainability matters for phishing detection
In a SOC, a model that flags emails without explaining itself creates more problems than it solves.
- Analysts need evidence behind every triage decision, not just a score
- Quarantining or blocking a message requires justification — especially when the sender is legitimate
- False positives erode trust in the tooling and slow down the team
- Feature-level explanations help analysts improve playbooks and user awareness training
- Models that explain themselves are far easier to tune and maintain over time
Black-box models can achieve impressive benchmark numbers but fail in production when the people using them cannot act confidently on the output.
2) Why Random Forest makes a good starting point
For phishing detection programs that are still maturing, Random Forest hits a sweet spot between capability and simplicity.
What works well
- It handles structured, behavioral, and linguistic features together without extensive preprocessing
- It is naturally robust to noisy feature sets — important when you are still refining your feature engineering
- Feature importance scores give analysts a window into what the model is actually keying on
- It supports fast iteration with controlled complexity
- The scikit-learn ecosystem makes it straightforward to build, validate, and deploy
Where to watch out
- Feature importance can be misleading when variables are correlated — permutation importance or SHAP values give a clearer picture
- Predicted probabilities may need calibration before you use them as operational thresholds
- Like any model, it needs ongoing monitoring for drift as attacker tactics shift
3) Feature families that drive real email triage
In phishing detection, the quality of your features usually matters more than the model you choose. The goal is to build features that map directly to the decisions analysts already make.
Feature families and what they tell you
| Feature family | Example signal | What it indicates | How analysts use it |
|---|---|---|---|
| Sender behavior | Sudden volume spike from a sender or domain | Possibly compromised or spoofed account | Compare against the sender’s historical baseline |
| Header anomalies | Mismatch between envelope sender and display name | Sender trust inconsistency | Quick authenticity check during triage |
| URL patterns | High link count, suspicious domains, unusual redirects | Link-based phishing lure | Prioritize for URL sandbox detonation |
| Urgency language | ”Immediate action required,” “account suspended,” deadline pressure | Social engineering pressure tactics | Boosts analyst confidence in flagging as phishing |
| Brand impersonation | Brand keywords paired with a non-brand sender domain | Likely impersonation attempt | Trigger brand abuse and takedown workflows |
| Reply-to mismatch | Reply address differs from the claimed sender | Response hijacking attempt | Escalate to spoofing and abuse review |
| Attachment metadata | Unexpected executable types, macros, or unusual archive formats | Potential malware delivery | Trigger attachment sandboxing and endpoint monitoring |
| Lexical features | Character-level anomalies, unusual token distributions | Template-generated or obfuscated content | Compare against known campaign language patterns |
| Message intent signals | Credential requests, payment update prompts, account verification asks | Business process abuse | Route to identity or finance-focused triage playbooks |
You do not need dozens of exotic features to get started. A focused set that aligns with how your analysts actually think about suspicious emails will outperform a sprawling feature set that nobody understands.
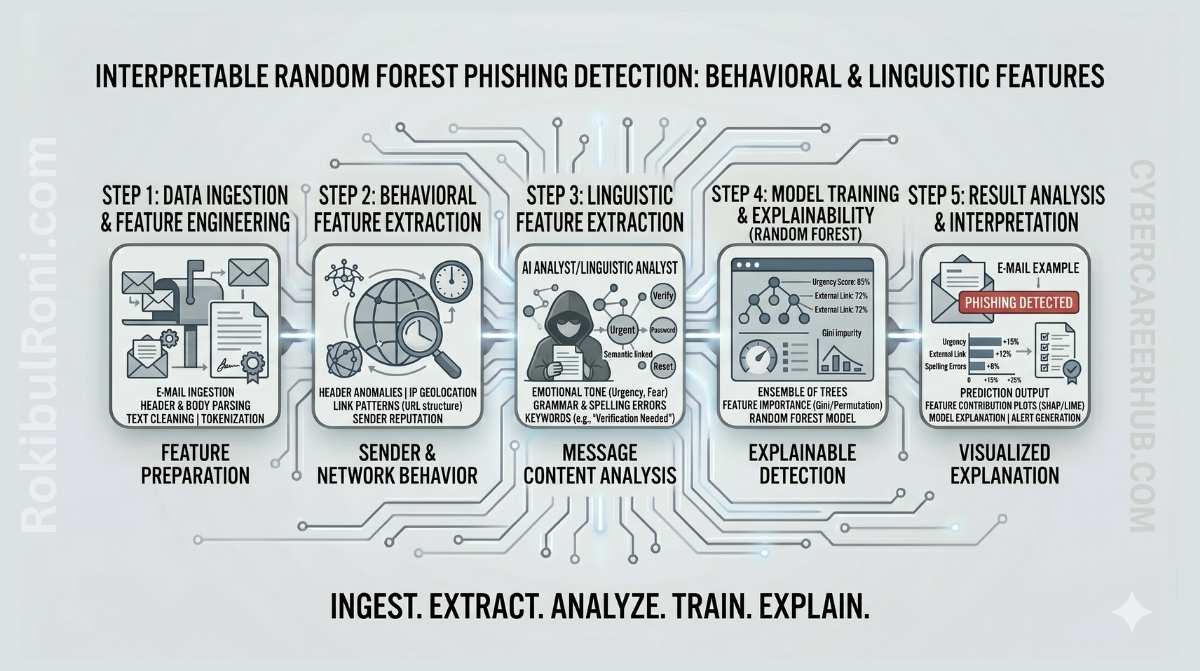
4) End-to-end workflow: from data to explainable decisions
Keeping the workflow aligned to SOC needs from the start prevents the common trap of building a model that performs well in a notebook but falls apart in operations.
Step 1: Data preparation
- Collect labeled email samples from trusted and representative sources
- Normalize fields — headers, body text, URLs, and metadata all need consistent formatting
- Remove or pseudonymize sensitive personal data as required by your data handling policies
- Split data using a time-aware strategy so the model is evaluated on future-like data, not data it could have memorized
Step 2: Feature engineering
- Build behavioral sender features — sending frequency, domain reputation signals, historical patterns
- Extract linguistic features — token patterns, urgency markers, readability anomalies
- Add structural features — header consistency checks, link and attachment statistics
- Validate feature quality and handle missing values thoughtfully
Step 3: Model training and validation
- Train a Random Forest baseline with cross-validation
- Evaluate using metrics that account for class imbalance (precision, recall, F1 — not just accuracy)
- Compare threshold choices and understand the precision/recall trade-off at each operating point
- Log model settings, feature versions, and experiment metadata so results are reproducible
Step 4: Explainability and analyst interpretation
- Rank global feature importance to understand what the model relies on overall
- Generate per-message explanation summaries showing the top contributing signals for each flagged email
- Map explanations to concrete triage playbook actions — “this was flagged because of X, so the next step is Y”
Step 5: Feedback loop and iteration
- Capture analyst overrides and the reasons behind them — this is your most valuable training signal
- Retrain periodically with attention to drift and emerging campaign patterns
- Re-evaluate thresholds as business context and risk appetite evolve
5) Python tooling stack
| Tool | Role in the pipeline |
|---|---|
| Python | End-to-end pipeline scripting and integration |
| Pandas | Data preparation, cleaning, and feature transformation |
| scikit-learn | Model training, cross-validation, and baseline evaluation |
| Jupyter | Exploratory analysis and explainability walkthroughs |
| Matplotlib / Seaborn | Feature importance visualization and confusion matrix interpretation |
| SOC integration layer | Delivering model output to the triage queue (API, webhook, or SIEM integration) |
Keep the stack simple and reproducible. You can add orchestration and advanced serving infrastructure later — the first priority is getting a working, explainable model into analyst hands.
6) Metrics that matter for operational deployment
Accuracy is a poor metric for phishing detection because the classes are heavily imbalanced. A model that labels everything as “benign” can hit 99% accuracy and catch zero phishing emails.
| Metric | Why it matters | What it tells you operationally |
|---|---|---|
| Precision | How many flagged emails are actually phishing | Low precision means alert fatigue and eroded analyst trust |
| Recall | How many real phishing emails the model catches | Low recall means dangerous emails are getting through |
| F1 score | Balances precision and recall into a single number | Useful for comparing model versions at the same threshold |
| False-positive rate | How often benign emails get flagged | Directly drives analyst workload — track by department |
| Confusion matrix | Shows the full error pattern | Helps identify which types of mistakes to focus on |
| Analyst acceptance rate | How often analysts agree with the model’s decision | The ultimate signal for whether explanations are working |
Threshold governance
- Start with a conservative threshold for protecting high-risk inboxes (executives, finance, IT)
- Tune thresholds per department based on sensitivity and tolerance for review volume
- Review threshold performance weekly during the first month of deployment
7) Designing explanations that analysts actually use
The explanation layer is where your model either earns analyst trust or loses it. Every explanation should answer two questions: “Why is this suspicious?” and “What should I do next?”
What a good explanation output looks like
| Field | How it helps the analyst |
|---|---|
| Risk score | Prioritizes the triage queue — highest risk first |
| Top 3 contributing signals | Gives the “why” at a glance without requiring model expertise |
| Similar historical pattern | Provides campaign context — “we saw this pattern last month” |
| Confidence band | Helps the analyst decide whether to act immediately or investigate further |
| Recommended next action | Links directly to the relevant triage playbook step |
What makes an explanation useful
- It is short, consistent, and focused on evidence
- It avoids model jargon — “feature_23 contributed 0.18” means nothing to an analyst
- It ties back to observable message artifacts (the URL, the header mismatch, the urgency language)
- It connects to a concrete next step the analyst can take
8) Getting model output into the SOC workflow
A model that lives in a Jupyter notebook is not a detection tool. The real value comes when model output flows into the systems analysts already use.
Integration blueprint
- Deliver model scores and labels to your existing case management or triage queue
- Attach explanation metadata to each detection — the analyst should see the “why” without digging
- Route high-confidence detections to a faster containment path (auto-quarantine with analyst review)
- Collect structured analyst feedback — tags like
confirmed phish,benign,needs investigation - Feed confirmed outcomes back into the retraining pipeline
How model output maps to SOC stages
| SOC stage | What the model provides | What the analyst does |
|---|---|---|
| Pre-triage | Risk score and explanation summary | Prioritize the queue |
| Triage | Feature-driven rationale with message artifacts | Validate, classify, and decide |
| Escalation | Confirmed indicators and campaign linkage | Contain the threat and notify affected users |
| Post-case | Analyst decision and correction tags | Feed back into model improvement |
9) Limitations you need to be honest about
Overclaiming model capabilities is a fast way to lose analyst trust and set unrealistic expectations with leadership.
What to acknowledge upfront
- Your dataset has quality and representativeness limits — it does not cover every phishing variant
- Attackers adapt, and campaign tactics drift over time
- Class imbalance and inconsistent labeling in real SOC data introduce noise
- Privacy constraints may prevent you from using certain content-level features
- Ambiguous cases will always require human judgment
How to mitigate each limitation
| Limitation | What to do about it |
|---|---|
| Data drift | Schedule retraining and monitor feature distributions for shifts |
| Inconsistent labels | Create an analyst labeling guide and run periodic QA on label quality |
| Privacy restrictions | Lean on metadata and behavioral features rather than raw email content |
| Model overconfidence | Use confidence bands and require human review for borderline scores |
| Novel campaigns | Supplement the model with heuristic rules and threat intelligence feeds |
10) Common mistakes that derail phishing detection projects
- Chasing benchmark scores without considering operational fit
- Ignoring the analyst experience — explanations that make sense to a data scientist but not to a tier-1 analyst
- Using the same threshold across every department regardless of risk profile
- Deploying the model and walking away without drift monitoring
- Treating model output as ground truth instead of analyst intelligence
- Failing to version datasets, features, and model artifacts — making debugging impossible
Four guardrails to enforce
- No deployment without explanation output attached to every detection
- No retraining without labeled data quality checks
- No threshold change without reviewing the precision/recall impact
- No SOC rollout without a defined escalation playbook
11) Research-to-SOC roadmap
Phase 1: Build the baseline (Weeks 1–2)
- Assemble a labeled dataset with a clear feature schema
- Train your first Random Forest baseline
- Produce an initial feature importance analysis
Deliverable: a baseline model card with metric snapshots
Phase 2: Explainability and analyst fit (Weeks 3–4)
- Design the per-message explanation format
- Run a pilot with a small group of analysts and collect their feedback
- Adjust features and thresholds based on what they tell you
Deliverable: an analyst-ready explanation template with tuning notes
Phase 3: Controlled SOC pilot (Weeks 5–6)
- Deploy in advisory mode — flag emails but do not auto-block anything yet
- Measure analyst acceptance rate, precision, and impact on review time
- Compare model findings against your existing email security controls
Deliverable: a pilot effectiveness report with go/no-go recommendation
Phase 4: Operational hardening (Weeks 7–8)
- Wire up the feedback loop and set a retraining schedule
- Define governance for threshold updates, model versions, and rollback procedures
- Expand coverage gradually by business segment based on pilot results
Deliverable: a production readiness decision pack
12) Maturity metrics for ongoing program health
| Metric | What it signals | Desired trend |
|---|---|---|
| Precision at operating threshold | How efficiently analysts spend their triage time | Up |
| Recall on validated phishing sets | How well the model protects users | Up |
| Analyst acceptance rate | Whether explanations are clear and trustworthy | Up |
| Time to triage flagged messages | How much the model speeds up the workflow | Down |
| Drift detection frequency | How quickly you catch environmental changes | Stable and actionable |
| Retraining cycle completion rate | Whether the feedback loop is actually running | Up |
Interpretable phishing detection works best when you treat model output as analyst intelligence — not an autonomous authority. Clear features, honest limitations, consistent feedback loops, and operations-first governance are what make it sustainable.
Model operations worksheet
| Workstream | Owner | First action | How you know it is working |
|---|---|---|---|
| Data quality governance | Data/security analyst | Define label and feature quality checks | Lower noise and more stable retraining |
| Explainability quality | Detection engineer | Standardize the top-signal explanation format | Higher analyst trust and adoption rates |
| Threshold management | SOC lead | Calibrate thresholds by risk level and workload | Better precision/recall balance in practice |
| Feedback pipeline | Detection team + SOC | Capture analyst overrides with reasons | Faster model improvement cycles |
Weekly operating checklist
- Review false positives and look at the explanation context — is the model confused, or is the feature noisy?
- Check drift indicators against recent email campaigns
- Track analyst acceptance of flagged messages — declining acceptance is an early warning sign
- Document any threshold changes with rationale and observed impact
Model handoff and governance pack
| Artifact | What it must contain | Who uses it |
|---|---|---|
| Model card | Data window, features, metrics, and limitations | Security leadership and analysts |
| Explainability template | Top contributing signals and recommended triage action | SOC analysts |
| Drift report | Feature and behavioral shifts with confidence impact | Detection engineers |
| Retraining log | Version changes and outcome comparison | Governance and audit stakeholders |
Quality checks before handoff
- Are explanations actionable within actual analyst workflows?
- Are model updates tied to measurable performance changes?
- Are limitations communicated clearly to the people making decisions?
90-day research-to-operations cadence
Days 1–30: Foundation
- Lock down the dataset schema and labeling standards
- Baseline model explanations with analyst feedback
- Establish initial model governance metrics
Days 31–60: Tuning
- Adjust threshold policy by business unit and use-case risk
- Improve drift monitoring and set up retraining triggers
- Integrate model outputs with the SOC triage queue
Days 61–90: Review and iterate
- Run an operational review of precision, recall, and analyst acceptance
- Refine the feature set based on recent campaign behavior
- Publish a next-cycle roadmap for model and process improvements
| KPI | Why it matters |
|---|---|
| Analyst acceptance rate | Tells you whether explainability and trust are where they need to be |
| False-positive trend | Shows whether triage burden is improving or getting worse |
| Drift detection turnaround | Reflects how resilient the model is to changing conditions |
| Retraining effectiveness delta | Confirms that updates are delivering real performance gains |
Interpretable models become operationally valuable when you treat data discipline, analyst usability, and governance cadence as equal priorities — not afterthoughts.
Model monitoring and explainability reporting
If this model is going to earn long-term trust in a security workflow, it needs two things: stable performance over time and consistent explanations that analysts can rely on.
Monthly monitoring checks
| Check | What you are looking for |
|---|---|
| Data drift | Feature distributions shifting — often driven by new campaign language patterns |
| Performance drift | Precision or recall changing on recently labeled samples |
| Label quality | Growing disagreement between analyst labels and model predictions |
| False-positive clusters | Repeated benign email templates triggering alerts |
Explainability report template (per model release)
- Which features are most influential overall (top 10)
- Which features dominate in false positives — these are your tuning targets
- Example explanations for 3–5 real alerts showing what an analyst would see
- Known limitations for this version (languages, short messages, unusual formatting)
Governance basics
- A named owner approves every model release
- Changes are versioned and reversible
- The model never replaces human judgment for irreversible actions like blocking a sender permanently
This is how interpretable ML stays reliable in security operations: monitored drift, documented explanation behavior, and controlled releases with clear ownership.