During an active incident, logs tell you what systems claim happened. Packets show you what actually moved across the wire. That difference matters more than most analysts appreciate — it’s often what separates a confirmed compromise from a false alarm, or a misconfiguration from a genuine threat actor.
Wireshark is most valuable when you treat it as an evidence workflow rather than a packet browser. Opening a PCAP and scrolling through frames rarely produces useful results. What produces results is disciplined collection, structured triage, and careful correlation with the telemetry you already have.
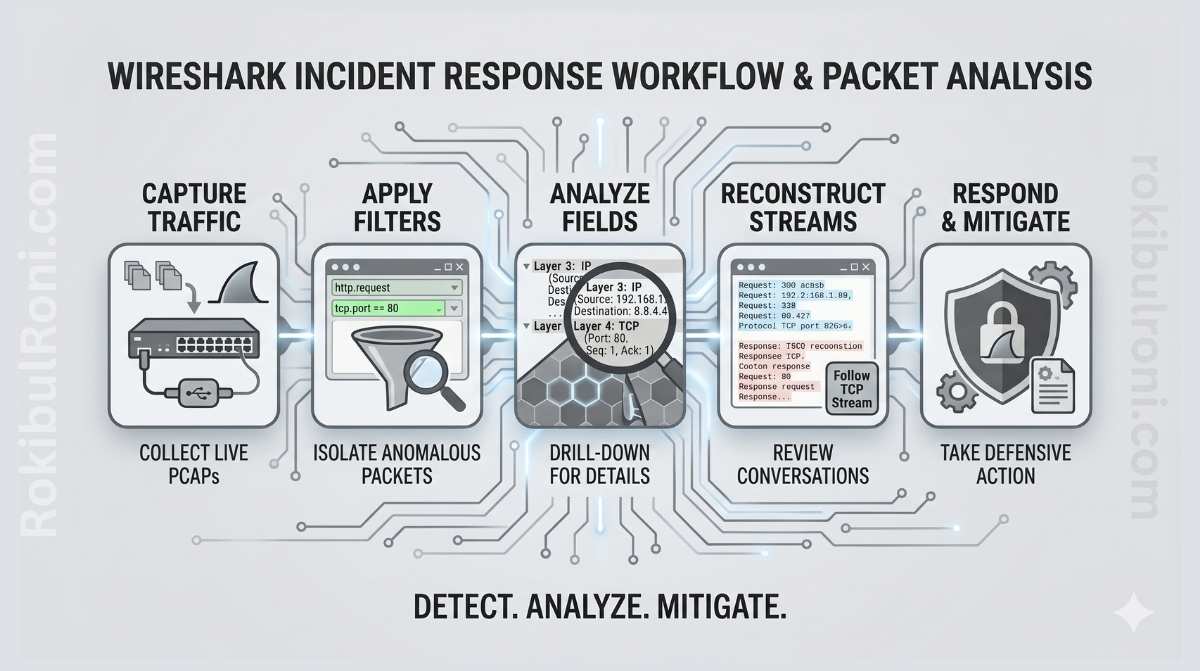
Wireshark incident response workflow
This guide covers how to use Wireshark effectively for defensive, investigation-focused packet analysis in authorised environments.
Why packet evidence belongs in incident response
Network logs are high-level summaries. Packets are ground truth. That distinction becomes important when you’re trying to answer questions that logs can’t resolve cleanly:
- Was the suspicious traffic a real outbound connection or a log parsing artefact?
- What exactly was transferred, and in which direction?
- Did the protocol behavior match what the application should be doing?
- Is this endpoint scanning, or is it normal service polling that looks like scanning?
Packet analysis helps with all of these. It validates suspicious events from SIEM and EDR timelines, exposes protocol-level behavior that high-level logs miss, confirms source-destination-timing relationships, and provides the kind of defensible evidence that holds up in post-incident reviews or compliance audits.
That said, packet evidence is strongest when combined with endpoint telemetry, authentication logs, and firewall data. Packets alone are rarely the full picture.
Choosing the right source for each investigation question
One of the most common mistakes in incident triage is reaching for the wrong tool first. Packets are the right source for some questions and a slow, inefficient source for others.
| Investigation Question | Best Starting Source | Why |
|---|---|---|
| Was there suspicious outbound communication? | PCAP plus firewall logs | Packets confirm protocol and flow details while firewall logs add policy context |
| Did a user account behave unusually? | Identity and auth logs first | Identity systems provide direct account activity detail that packets can’t easily surface |
| Was data transferred externally? | PCAP plus proxy logs plus endpoint telemetry | Packets reveal transfer behavior; logs add user and process context |
| Is this endpoint scanning or normal service polling? | PCAP first | Traffic patterns and timing expose reconnaissance behavior clearly |
| Did a web or API route receive malformed requests? | Web logs plus WAF, then selective packet review | App logs show semantic context; packets validate raw request patterns |
A practical rule that holds up well in practice: start with logs for broad triage, then use packets to confirm critical unknowns. Don’t open Wireshark until you have a specific question you need it to answer.
Handling PCAPs before you open Wireshark
Evidence handling is unglamorous work, but getting it wrong can undermine an otherwise solid investigation — especially if findings need to hold up in legal or regulatory review.
PCAP preservation checklist:
- Preserve the original PCAP as read-only evidence before doing anything else
- Record the collection source, capture tool, and interface used
- Hash the evidence file with SHA-256 and store the hash separately
- Document the timezone and how timestamps were normalised across systems
- Use a case ID and maintain a chain-of-custody log for any transfers
- Redact sensitive data in shared exports — never in the originals
Chain-of-custody table:
| Field | What to Record |
|---|---|
| Case ID | Unique incident identifier |
| Evidence ID | PCAP filename and storage path |
| Collected by | Name, role, and timestamp of collection |
| Source | Sensor, TAP, host, or capture point |
| Integrity hash | SHA-256 value |
| Access log | Who accessed the evidence and when |
| Transfer notes | Any storage moves and access approvals |
This discipline takes five minutes to set up and protects weeks of investigative work from being challenged on procedural grounds.
A step-by-step Wireshark triage workflow
The value of a structured workflow is that it keeps analysis focused and reproducible. Without it, packet triage tends to become unfocused — analysts chase interesting-looking frames without answering the questions that actually matter.
Step 1: Profile the capture first
Before filtering anything, get a high-level picture. Confirm the capture timeframe and total packet count. Identify top talkers by source and destination. Review the protocol distribution for anything unexpected. Flag unusual spikes in traffic volume or session count that don’t align with the timeframe’s expected activity.
Step 2: Identify conversations and sessions
Use the conversation and endpoints views to see which flows dominate the capture. Group suspicious flows by protocol and destination. Prioritise external destinations with unusual traffic volume, timing, or protocol behavior.
Step 3: Review protocol behavior in detail
- DNS: look at query patterns, response consistency, query volume, and unusual domain naming
- HTTP: examine request methods, path patterns, response codes, and host header behavior
- TLS: review SNI values, certificate hints (where visible), and handshake behavior
- Uncommon ports: check for protocol mismatches where traffic on a standard port doesn’t match the expected protocol
Step 4: Correlate with your other telemetry
Align packet timestamps with firewall event logs. Map source hosts to endpoint telemetry and process execution data. Validate authentication events around the timeframes where suspicious network activity appears. Packet analysis without this correlation step produces hypotheses, not findings.
Step 5: Document before you close the capture
Capture evidence snippets with exact timestamps. Record your confidence level and the current status of each hypothesis — confirmed, plausible, or ruled out. Document recommended next actions: containment, deeper forensic work, or closure criteria.
Useful Wireshark filters for defensive triage
Filters are how you focus on what matters without losing context. The goal is precision — over-filtering too early can hide relevant signals you haven’t thought to look for yet.
| Goal | Filter Approach | What It Surfaces |
|---|---|---|
| DNS triage | dns | Domain lookups, query frequency, suspicious naming patterns |
| HTTP request review | http | Request methods, paths, response codes, host behavior |
| TLS metadata review | tls | Handshake patterns, SNI values, cert-related context |
| Single host traffic | ip.addr == <host_ip> | Host-centric network behavior timeline |
| External destination focus | Negate internal ranges | Outbound communication candidates |
| Error and retransmission review | TCP analysis flags | Session instability, potential injection, packet quality issues |
Apply filters progressively rather than all at once. Start broad to understand the overall picture, then narrow to validate specific hypotheses.
A consistent triage table for every investigation
Using the same question structure across cases makes analysis faster and handoffs cleaner. This table format works well as a starting point for each investigation.
| Question | Where to Look | Evidence to Capture | Next Step |
|---|---|---|---|
| Is there suspicious outbound communication? | Conversations view, external destination flows | Session timeline, destination profile, byte counts | Correlate with endpoint process data and firewall policy |
| Did DNS behavior deviate from baseline? | DNS query and response patterns | Query volume anomalies, rare domain patterns | Check endpoint timeline and available threat intel |
| Is there a potential data transfer anomaly? | Long sessions, large payloads, repeated external posts | Flow duration and transfer metadata | Validate against approved application behavior |
| Are there signs of unauthorised service discovery? | Port and protocol scans, connection bursts | Sequential connection attempts and host targeting patterns | Segment the source host and run endpoint triage |
| Is encrypted traffic limiting visibility? | TLS sessions | Metadata-only visibility — document the limitation | Use proxy, firewall, and endpoint logs for complementary context |
Common incident scenarios and how to approach them
Suspicious outbound connection
Start by confirming host and user context from your SIEM or EDR. Check the destination’s reputation and whether it appears in any historical baseline for that host. Review the timing of the connection relative to process execution events on the endpoint. Then classify: known service, misconfiguration, or potential compromise.
Possible data exfiltration indicator
Review session size, timing patterns, and whether the behavior recurs. Compare the destination against approved business integrations. Correlate with file access logs and endpoint activity from the same timeframe. Escalate if the evidence supports an unauthorised transfer hypothesis.
Potential malware callback
Look for recurring connections with periodic, beacon-like timing. Compare the protocol behavior against what’s normal for that host. Check for endpoint detections, startup persistence mechanisms, or anomalous process behavior. Isolate the host if confidence increases after correlation.
DNS anomaly
Track high-volume or rare-domain query behavior. Look at TTL consistency and resolution stability — DNS tunnelling and C2 staging often show unusual TTL patterns. Correlate with user session changes and outbound connection timing. Escalate if the pattern aligns with known staging or exfiltration behavior.
Unauthorised service discovery pattern
Review connection attempts across many ports or hosts within short time windows. Check whether the source is an approved vulnerability scanner or admin tooling. Confirm whether there’s a change ticket or scheduled scan context that explains the behavior. Trigger containment if the reconnaissance is confirmed as unapproved.
Writing a network forensics summary that drives decisions
A packet analysis summary that just describes what was observed is only half the job. Good summaries translate observations into decision-ready intelligence.
Effective summary structure:
- Case context: why packet analysis was initiated and what question it was trying to answer
- Data scope: capture source, timeframe, and what the capture doesn’t cover
- Key observations: the three to five most significant findings with timestamps and supporting evidence
- Correlation findings: what endpoint, firewall, and authentication data confirmed or disproved
- Assessment: likely benign, suspicious but unconfirmed, or confirmed incident path
- Recommended actions: specific containment steps, deeper forensic work required, or closure criteria
One-page summary table:
| Section | What to Include |
|---|---|
| Scope | Capture window, sensors used, host focus |
| Findings | Three to five evidence-backed observations |
| Confidence | Low, medium, or high — with rationale |
| Impact | Potential business or operational effect |
| Actions | Immediate steps, short-term follow-up, and longer-term requirements |
Keep language precise and resist the temptation to speculate beyond what the evidence actually supports. Decision-makers who read your summary will act on it — they need to know what you actually found.
Mistakes that undermine packet-based triage
Most packet analysis errors come from a small set of recurring patterns. Being aware of them makes them easier to avoid.
- Drawing conclusions from a single suspicious packet before correlating with other sources
- Ignoring timezone alignment between Wireshark, SIEM, and endpoint tools — this causes more timeline confusion than almost anything else
- Modifying the original PCAP instead of working from a copy
- Treating encrypted traffic as “no evidence available” rather than using available metadata alongside complementary logs
- Overlooking normal admin and scanner traffic that was simply undocumented
- Failing to record which filters and analysis steps were used — this makes findings impossible to reproduce
- Reporting observations without stating a confidence level or acknowledging limitations
Quick anti-error checklist before finalising findings:
- Time alignment confirmed across packet, SIEM, and endpoint timelines
- Original evidence hashed and stored read-only
- Suspicious signals corroborated by at least one additional source
- Analysis notes include filters used, pivots made, and reasoning behind each step
Wireshark IR checklist for recurring use
Run this checklist on every packet-based investigation to ensure consistency.
| Phase | Checklist Item | Done |
|---|---|---|
| Preparation | Case ID created and evidence handling plan documented | ☐ |
| Preservation | Original PCAP stored read-only with integrity hash | ☐ |
| Triage | Capture window and top talkers identified | ☐ |
| Protocol review | DNS, HTTP, TLS, and port behavior reviewed | ☐ |
| Correlation | Firewall, endpoint, and auth logs cross-checked | ☐ |
| Evidence | Key packet findings timestamped and documented | ☐ |
| Assessment | Confidence level and limitations clearly stated | ☐ |
| Handoff | Summary and recommended actions delivered | ☐ |
When followed consistently, this workflow turns Wireshark from a packet viewer into a reliable incident evidence engine.
Escalation decisions: not every suspicious packet warrants a major incident
One of the harder judgment calls in packet-based triage is deciding when to escalate. Too aggressive and you burn team capacity on noise. Too conservative and real incidents get delayed. A consistent decision matrix helps.
| Signal Strength | Business Context | Recommended Action |
|---|---|---|
| Low — single weak indicator | Low-criticality asset | Continue monitoring and gather more context before deciding |
| Medium — multiple suspicious indicators from different sources | Standard production service | Open an investigation case and assign an analyst owner |
| High — clear malicious pattern with corroborating evidence | Critical service or sensitive data path | Escalate to incident response and initiate containment immediately |
| High but uncertain scope | Mixed or unknown asset ownership | Escalate with limited containment and rapid ownership validation |
This prevents the two failure modes that hurt teams most: overreaction that creates noise and erodes trust, and under-escalation that lets real incidents progress.
Building team capability: the 30-minute packet triage drill
Packet analysis is a perishable skill. Teams that don’t practice it regularly find that their real-incident performance degrades even when the tooling is solid. Short, structured drills fix this.
Drill structure:
- Minutes 0–5: Confirm case context, capture scope, and the specific question the analysis needs to answer
- Minutes 5–15: First-pass conversation and protocol analysis
- Minutes 15–25: Correlate one suspicious signal with endpoint, firewall, or authentication logs
- Minutes 25–30: Produce a one-page summary and make an escalation decision
Drill scoring areas:
| Area | What to Score |
|---|---|
| Evidence quality | Are observations timestamped and reproducible by another analyst? |
| Correlation quality | Did the analyst validate the packet signal with a second source? |
| Decision quality | Was the escalation logic justified and consistent with the matrix? |
| Communication quality | Is the summary clear enough for both responders and managers? |
Running these drills monthly or quarterly pays dividends when real incidents happen. Speed and accuracy under time pressure are skills that only develop through practice.
Organisational readiness: making sure captures are usable when you need them
Wireshark skills are only half the equation. If your organisation can’t reliably produce the right captures quickly and with appropriate privacy handling, the tool doesn’t matter.
Capture policy basics:
| Topic | Standard |
|---|---|
| Where to capture | Defined choke points — edge, data centre, key VLANs |
| When to capture | Triggered during incident windows, plus periodic baselines |
| Retention | Time-boxed retention aligned to policy and storage constraints |
| Access | Least-privilege access to PCAPs and any associated decryption keys |
| Privacy | Clear redaction and handling procedures for sensitive data in captures |
What makes a “good PCAP” from an investigation standpoint:
- Accurate timestamps from NTP-synchronised sources
- Interface and capture point documented at time of collection
- Known filtering decisions recorded — what was excluded and why
- Associated artefacts linked: host logs, proxy logs, alert tickets, case IDs
Integrating capture capability into your IR runbook:
- Define “capture now” versus “capture on request” trigger criteria
- Pre-stage capture tools or scripts on critical hosts and segments
- Document escalation paths for when packet analysis requires network engineering support
Training and validation:
Run a quarterly drill that captures and analyses a benign scenario — a DNS lookup plus TLS handshake works well. Use the post-drill review to identify missing telemetry, capture blind spots, and access bottlenecks before they become a problem during a real incident.
90-day plan for building a packet analysis capability
Days 1–30: Establish the foundation
- Standardise PCAP handling procedures and summary templates across the team
- Run weekly packet triage drills using sample scenarios from public PCAP repositories
- Baseline analyst timing and confidence metrics so you have a baseline to improve against
Days 31–60: Improve integration and decision quality
- Improve cross-tool timeline correlation quality — this is usually where the biggest gaps are
- Refine the escalation matrix based on what drill outcomes reveal about decision consistency
- Build a library of reusable packet-analysis playbook snippets for common scenarios
Days 61–90: Embed into operations
- Integrate packet-triage outputs into incident postmortems so findings feed back into detection
- Track reduced decision time and false escalation rate as key improvement indicators
- Publish an updated IR packet-analysis operating standard that reflects what the team has learned
| KPI | Why It Matters |
|---|---|
| Cases with complete evidence chain | Measures forensic reliability |
| Mean time to triage decision | Indicates response efficiency |
| Multi-source corroboration rate | Reflects analysis quality |
| False escalation rate | Tracks decision accuracy over time |
Packet analysis creates its greatest operational value when evidence handling, triage logic, and escalation decisions are standardised and practiced as one repeatable IR capability — not as an individual skill that lives with one analyst.