Web attacks aren’t just app security’s problem anymore. Your SOC sees credential abuse, path scanning, weird API calls, and bot noise before engineering even knows there’s a problem. The difference between useful alerts and pure noise comes down to how well you build your detection rules.
This guide is about practical, real-world detection work in Splunk. You’ll see logic examples at a high level—not exact copy-paste queries—so you can adapt them to your environment without building brittle, unmaintainable rules.
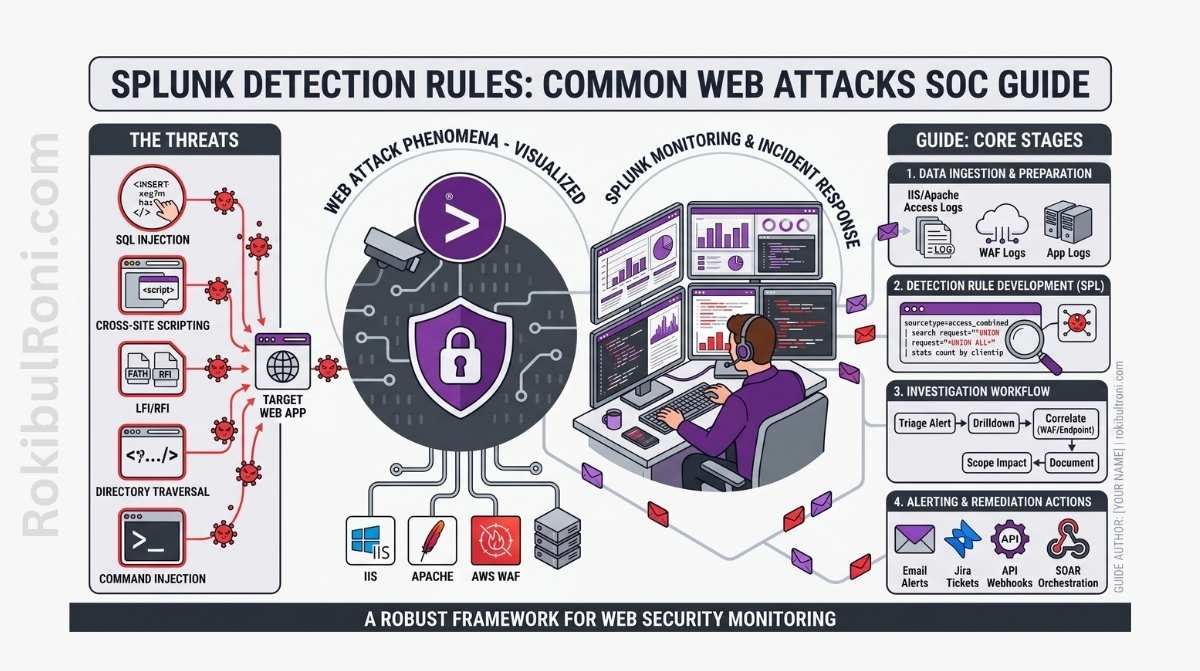
Building Splunk Detection Rules for Web Attacks
Follow this workflow and you’ll build detections that analysts can actually triage quickly.
1) Why Your SOC Should Care About Web Attacks
- Your web apps and APIs are attack targets every single day, not just during occasional testing.
- Your SOC sits at the intersection of endpoints, identities, networks, and applications—so you see patterns nobody else does.
- Catching web attacks early keeps the blast radius small.
- Detection metrics give you proof that security is actually improving.
If you’re not seeing web attack signals in your SOC, you’re probably blind to large parts of what’s actually happening.
2) Get Your Data In Shape First
You can’t build good detection rules if your logs are a mess. Clean data beats fancy logic every time.
Log Sources You Need
- Web server logs (nginx, Apache, ingress controllers)
- WAF logs (cloud-managed or your own)
- Application authentication logs
- Reverse proxies and load balancers
- API gateways
- Server telemetry (what’s running on the actual web servers)
- Firewall and network security logs
Fields You Must Have
| Log Type | Fields You Need | Why |
|---|---|---|
| Web/HTTP | timestamp, src_ip, method, uri_path, status, user_agent | Tells you what traffic came, from where, and what the app said |
| Authentication | user, auth_result, src_ip, session_id, target_app | Catch brute force and account abuse |
| WAF | rule_id, action, matched_pattern, host, uri | Understand what attacks your WAF blocked |
| API Gateway | api_route, client_id, latency, response_code, rate_limit_signal | Spot API abuse and performance issues |
| Endpoint | host, process, network_connection, destination | Connect web activity to what’s actually happening on the server |
Pro tip: Fix inconsistent field names before you start building detections. You’ll save yourself a lot of pain.
3) Which Web Attacks to Detect First
Start with patterns that give you good signal and are easy for analysts to understand.
Attack Patterns Worth Detecting Now
- SQL injection: When request patterns look like SQLi or your WAF blocks them
- XSS: Payloads in request parameters or suspicious response behavior
- Path traversal: Access attempts to files and routes that shouldn’t be public
- Brute force/spraying: Lots of failed logins from one source, or one user failing everywhere
- Weird user-agents: Randomized or tool-like agents accessing your app
- 404 scanning: Lots of “not found” errors on sensitive paths (looks like reconnaissance)
- HTTP method abuse: Using DELETE, PATCH, or PUT on routes that don’t expect it
- API abuse: Clients hammering your API, misusing endpoints, token anomalies
Detection engineering table
| Use Case | Log Source | Fields Needed | Triage Question | Tuning Notes |
|---|---|---|---|---|
| SQLi Indicators | WAF + Web logs | uri, query_string, rule_id, status | Is this blocked probing or successful backend impact signal? | Add baseline by app path and expected parameter formats |
| XSS Indicators | Web + WAF + App logs | uri, param_key, status, action | Did payload reach app logic or get blocked at edge? | Suppress known safe test routes and QA traffic |
| Path Traversal Attempts | Web + Reverse proxy logs | uri_path, status, src_ip, host | Are restricted file paths being targeted repeatedly? | Threshold by source + target sensitivity |
| Auth Brute Force | Auth + WAF + Identity logs | user, auth_result, src_ip, session | Is this user lockout noise or coordinated credential attack? | Tune by tenant/user behavior baseline and MFA context |
| Suspicious User-Agent | Web logs | user_agent, src_ip, uri_path, request_rate | Is agent behavior consistent with approved scanners/monitors? | Maintain allowlist for legitimate monitoring systems |
| High 404 Recon Signal | Web + CDN logs | status, uri_path, src_ip, host | Is this normal broken-link traffic or endpoint discovery activity? | Exclude known crawler ranges where appropriate |
| Unusual HTTP Methods | Web + API gateway | method, route, status, client_id | Is method valid for this route in production behavior? | Route-method allowlist based on API specs |
| API Abuse Signal | API gateway + Auth logs | client_id, token_id, route, latency, code | Is this legitimate burst traffic or abuse pattern? | Tune per client tier and documented rate policies |
4) MITRE ATT&CK mapping for SOC context
Mapping helps detection coverage reporting and incident communication.
| Detection Theme | Example ATT&CK Tactic | Example ATT&CK Technique (High-Level) |
|---|---|---|
| Credential abuse patterns | Credential Access | Brute Force |
| Web path and endpoint probing | Discovery | Network Service Discovery / Application Discovery context |
| Web command-like input abuse signals | Initial Access / Execution context | Public-facing application abuse context |
| Data access anomaly through API | Collection | Data from Information Repositories context |
Use ATT&CK mapping as communication metadata, not as proof that an attack stage is complete.
5) How to Design a Splunk Detection Rule
A good rule answers exactly one question that an analyst needs to ask.
Before You Write Any SPL
- Know what you’re looking for: Write it down. What behavior is suspicious?
- Check your fields: Make sure you have the data you need.
- Pick a time window: How fast does this attack happen? Use that for your window.
- Set your threshold: Don’t just guess—use historical data to set your baseline.
- Decide severity: When this fires, how serious is it?
- Add context: Criticality, owner, environment—things that help triage.
- Write the triage steps: What should an analyst check when this alert comes in?
The Logic Pattern (In Plain English)
- Look at the apps and HTTP patterns you care about
- Count things by source, target, and time bucket
- Compare what you’re seeing now to normal historical patterns
- Tag it with context (is it critical, who owns it, what environment)
- Only alert when the volume is abnormal AND something else looks wrong
This keeps your rules understandable for analysts and makes them easier for engineering teams to help tune.
6) Kill False Positives Without Going Blind
The trick is tuning your rules enough to not waste analyst time, but not so much that you miss real attacks.
How to Reduce Noise
- Dynamic thresholds: Different apps behave differently, so your threshold should too
- Allowlists: Document your security scanners, monitoring tools, and other legitimate traffic
- Route sensitivity: Your admin routes should trigger faster than static file routes
- Criticality: Critical systems get alert severity bumped up; dev systems get tuned looser
- Talk to developers: Ask them what the app actually does so you know what’s normal
Keep Tuning On Schedule
| What to Do | How Often | Who Does It |
|---|---|---|
| Review alert quality | Weekly | SOC detection engineer |
| Dig into false positives | Weekly | SOC + App Security |
| Update allowlists and baselines | Every two weeks | SOC platform owner |
| Review rule logic and thresholds | Monthly | Detection lead |
| Look for coverage gaps | Quarterly | SOC manager + security architecture |
7) Dashboard ideas that support real triage
Dashboards should drive action, not vanity metrics.
Useful SOC dashboard widgets
- Top attacked endpoints by count and trend
- HTTP status code spikes by application/environment
- Authentication failure heatmap by user/source
- WAF block vs allow trend by rule category
- Suspicious parameter pattern frequency
- Source geography and ASN clustering for attack campaigns
- API route abuse rate by client identity
Pair each dashboard widget with an associated triage question so analysts know what to do next.
8) How to Hand Off an Alert to Incident Response
A good alert needs to tell the IR team exactly what to do. Not just “investigate this.”
What to Include in the Handoff
- One-sentence summary: What happened?
- Rule name and why it fired: Which detection caught this and why?
- Timeline: Exact UTC timestamps of key events, in order
- What’s affected: Specific endpoints, servers, environment
- Source context: Where did the traffic come from? Who was it?
- Related signals: WAF blocks, auth failures, endpoint activity, anything correlated
- What to do about it: Disable a token? Block a source? Lock a route?
- Open questions: What does engineering need to check?
Handoff Quality Check
| Part of the Alert | Should Sound Like This | Not Like This |
|---|---|---|
| Timeline | “2024-05-22 14:32:15Z: Failed auth from 203.0.113.45. 2024-05-22 14:33:00Z: Successful auth from same IP” | “Failed logins happened today” |
| What’s Broken | “Endpoint /api/v2/admin on web-prod-01 in the prod environment” | “Something in the web app” |
| Evidence | “Query returned 42 events. See event IDs 1234–1276 for full details” | “Here’s a screenshot” |
| What to Do | “Block 203.0.113.45 at the firewall and reset the compromised account” | “Please investigate this” |
9) Mistakes That Break Your Detection Program
- Dumping logs without parsing them: Raw logs are impossible to work with. Parse and normalize first.
- Alerting on everything with a static number: You’ll just get noisy alerts all day. Use baselines.
- Only looking at web servers, ignoring API gateways: You’ll miss a whole category of attacks.
- Building rules with no owner: Nobody cares about the rule when it breaks. Assign an owner.
- Trusting WAF block counts alone: WAF logs are part of the picture, not the whole picture.
- Not tuning after incidents: When a false positive burns an analyst or a real attack slips through, use it to get smarter.
- Rules with no documentation: Six months later nobody knows what the rule is for or how to fix it.
10) 30-Day Plan to Build Web Detection Right
| Week | What to Do | What You End Up With |
|---|---|---|
| Week 1 | Check your web logs for quality and missing fields | Report on field consistency + list of gaps |
| Week 2 | Deploy your first high-signal rules (auth abuse, 404 scanning, HTTP method misuse) | Baseline set of working rules |
| Week 3 | Reduce false positives by tuning + add owner and criticality metadata | Cleaner alerts + context for triage |
| Week 4 | Fix your incident handoff format and build a web detection dashboard | Standard template + visibility into detection quality |
Numbers to Track
- How many alerts are actually worth investigating?
- False-positive rate for each rule
- How long does it take analysts to triage a web alert?
- How many detections actually turn into incidents?
- Are you covering your critical apps and APIs?
When your SOC treats web detection like engineering instead of a one-time project, you get faster triage, better containment, and development teams actually trust your alerts.
Detection operations worksheet for SOC teams
| Workstream | Owner | First Action | Validation Signal |
|---|---|---|---|
| Data quality | SIEM engineer | Validate required fields by log source | Reduced null/parse failure rate |
| Use-case ownership | Detection lead | Assign owner to each detection use case | Clear escalation point for tuning updates |
| Triage readiness | SOC lead | Add triage questions to alert metadata | Faster analyst decision consistency |
| Tuning governance | Detection engineer | Schedule weekly false-positive review | Alert quality improves without blind spots |
SOC execution checklist
- Ensure every rule answers one clear investigative question
- Avoid deploying high-noise rules without baseline references
- Track suppression changes with owner and expiration
- Validate detection behavior after major app changes
Handoff package standard for incident teams
| Artifact | Minimum Content | Consumer |
|---|---|---|
| Alert context pack | Rule name, trigger logic summary, key fields | Tier-1/Tier-2 analysts |
| Correlation snapshot | Related auth/WAF/endpoint events | Incident responders |
| Scope summary | Affected app/route/session context | App owners + response team |
| Containment options | High-level recommended response actions | Incident commander |
Quality gates
- Can an analyst decide escalation from alert content alone?
- Are correlated signals sufficient to reduce false escalation?
- Is affected scope specific enough for engineering response?
Your 90-Day Detection Engineering Journey
Month 1: Fix the Foundation
- Get your web, app, and API log fields consistent
- Deploy your first set of high-signal web detections
- Write down the triage steps for each rule category
Month 2: Tune and Add Context
- Adjust thresholds based on what your app teams tell you is normal
- Add dashboards that show alert quality and how fast analysts work
- Kill recurring false positives by pattern type
Month 3: Expand and Mature
- Build detections for more of your business-critical endpoints
- Audit your rules—which ones still have owners? Which ones are stale?
- Write up what you learned and what comes next
| Metric | What It Tells You |
|---|---|
| Actionable alert ratio | Are analysts actually doing something with your alerts? |
| Mean time to triage | How fast can analysts figure out if something is real? |
| False-positive rate | Is your tuning getting better? |
| Incidents from detections | Are detections actually catching real attacks? |
The real trick is treating telemetry quality, rule ownership, and triage speed as one connected system. When those three work together, your detection program scales.
Detection engineering lifecycle (Splunk) without the chaos
Rules stay effective when they have an owner, a test method, and a controlled release process.
Rule “definition of done”
| Item | Minimum standard |
|---|---|
| Purpose | Clear threat/problem statement |
| Data sources | Required indexes/sourcetypes listed |
| Triage steps | 3–5 deterministic checks an analyst can follow |
| False-positive controls | Filters/suppressions documented with rationale |
| Owner | Named team/person responsible for tuning |
| Test data | Sample events or replay method documented |
Testing approach (practical)
- Unit test: query returns expected fields and does not error.
- Signal test: rule fires on known-bad simulated events or replayed incidents.
- Noise test: run against a typical week and record baseline alert volume.
Release controls
- Promote rules through
dev → stage → prodwith a consistent checklist. - Time-box high-risk changes and have rollback ready.
- Keep a changelog: what changed, why, and what metric improved.
Metrics that actually help
| Metric | Use |
|---|---|
| Alerts/day per rule | Identifies noisy or failing logic |
| True-positive rate | Validates detection value |
| Median triage time | Shows operational workload |
| Suppression count | Flags drift and environment changes |
This keeps Splunk detections professional-grade: tested, owned, and measurable over time.