Threat hunting begins where your alert system ends. Your alerts catch things your rules already know about, but hunting? Hunting finds what your rules are still blind to.
If you’re sitting on mountains of ELK logs but not getting structured, actionable investigations out of them, the problem isn’t the ELK stack itself. It’s usually poor hunt design, inconsistent field quality, and sloppy documentation habits.
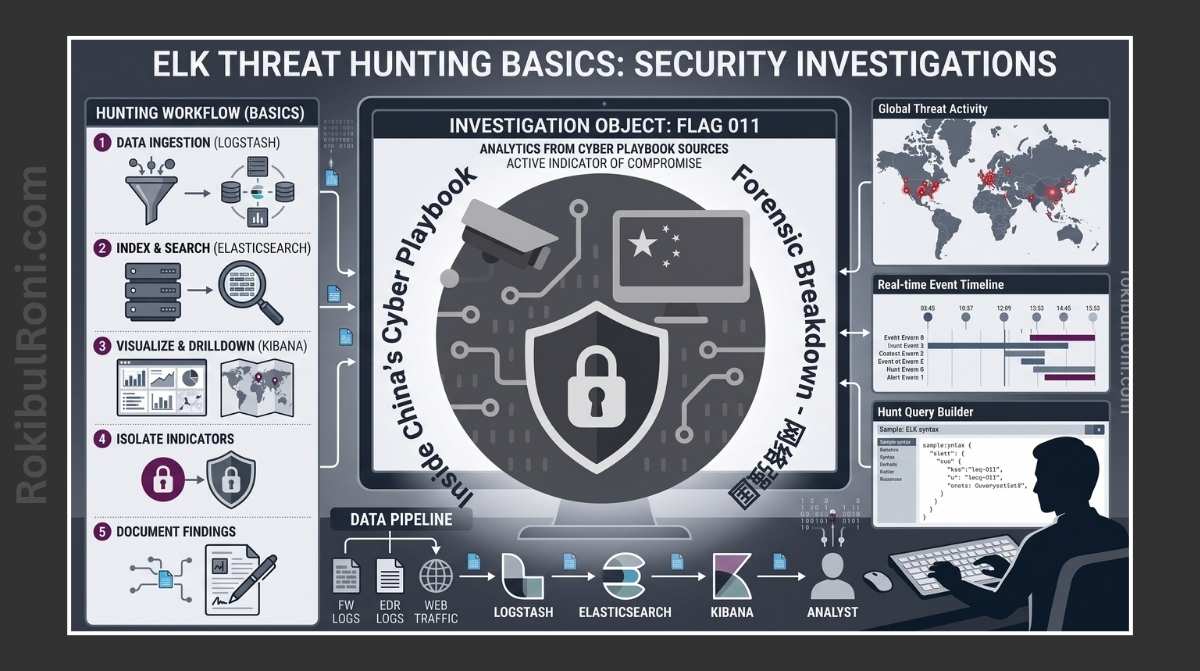
ELK Threat Hunting Basics
This workflow will help you run hunts that actually produce results you can measure and act on.
1) What Threat Hunting Actually Is (And Isn’t)
Threat hunting is essentially detective work. You start with a hypothesis—a question about what might be going wrong—then dig through your logs to find evidence. It’s proactive searching for suspicious behavior that your current alerts don’t catch.
How Threat Hunting Differs from Alert Triage
| Activity | What Drives It | What You’re Trying to Do | What You End Up With |
|---|---|---|---|
| Alert Triage | Alerts that already fired | Figure out if they’re real threats or false alarms | An incident ticket to work or a “false positive” note to close |
| Threat Hunting | Your own hypothesis + the logs | Find attackers and patterns your rules miss | New detection rules, data gaps you never knew about, or escalated cases |
Both matter. Triage cleans up the alerts you already have; hunting makes your alerts better at catching things you haven’t thought of yet.
2) Your ELK Stack: What You Actually Need
You don’t need a perfect, enterprise-grade ELK setup to start hunting. You just need data flowing through in a consistent, predictable way.
The Five Layers of Your Stack
- Ingestion: Beats, agents, or forwarders pull events from your systems
- Parsing: Logstash or ingest processors normalize the data and map fields consistently
- Storage: Elasticsearch indexes everything so you can query it fast
- Analysis: Kibana gives you dashboards, saved searches, and investigation timelines
- Detection: Elastic Security rules, cases, and automated response workflows
Before You Hunt: Quality Checks for Each Layer
| Layer | What You Need | Red Flag |
|---|---|---|
| Ingestion | Data consistently flowing from all your sources | A source suddenly goes quiet with no scheduled maintenance |
| Parsing | Field names and types stay the same across logs | The same piece of information appears in different fields with different names |
| Indexing | Data arrives on time and is searchable | You see gaps in data where you expect to see events |
| Analysis | Dashboards and queries you can reuse between hunts | Starting every hunt from scratch because nothing is documented |
| Detection | Your hunt findings easily turn into new detection rules | Good hunts just sit around and never become operational alerts |
Here’s the thing: if your field names and types are all over the place, even great analysts get slowed down. Fix that first, or you’ll waste time hunting.
3) Which Data Sources to Feed Into ELK First
Getting useful results comes down to having the right data, not drowning in everything.
Start with These Sources (In This Order)
- Authentication logs — Identity providers, Active Directory, SSO systems
- Endpoint logs — Process execution, parent-child relationships, network connections
- Firewall and network flow logs — Who’s talking to whom and when
- DNS and proxy logs — What domains are being queried, what traffic goes through
- Web and API access logs — Who hit which endpoints and what they asked for
- Cloud audit logs — Who did what in AWS/GCP/Azure control planes
Why This Order Actually Works
When you correlate auth logs with endpoint logs, you catch a lot of early warning signs. Add DNS and proxy logs, and you see command-and-control activity and data exfiltration. Cloud audit logs expose when someone abuses administrative privileges.
4) Your Hunting Workflow (Keep It Repeatable)
Follow a consistent workflow. This makes each hunt defensible, and it also makes it easier to turn hunting findings into permanent detection rules later.
The Seven-Step Hunt Loop
- Ask a Question (Your Hypothesis)
- Example: “Are our service accounts logging in from interactive terminals at weird times?”
- Pick Your Data Sources
- Choose the logs you need to answer that question.
- Set Your Baseline
- Look at historical normal behavior to compare against.
- Pivot Around the Data
- Start with one user/host/IP/process, then expand to related events.
- Review the Evidence
- Is this actually suspicious, or do you have a benign explanation for it?
- Reach a Conclusion
- Is this a real finding, a common false positive, or a data gap you discovered?
- Improve Detection
- If you found something real, turn that hunt logic into a new detection rule or dashboard.
Hunt workflow table
| Step | Key Question | Deliverable |
|---|---|---|
| Hypothesis | What suspicious behavior are we testing? | Written hypothesis statement |
| Data Selection | Which logs can prove or disprove it? | Source list + required fields |
| Baseline | What does normal look like for this behavior? | Baseline snapshot with time window |
| Pivot | What related entities/events should be explored? | Pivot map (user, host, process, IP) |
| Evidence | Is the signal suspicious after context checks? | Evidence packet with timestamps |
| Conclusion | Is this incident, benign, or inconclusive? | Hunt outcome classification |
| Improvement | What control should be improved next? | Detection/task backlog item |
5) Real Hunt Examples You Can Actually Run
These are practical, defensive hunts. No attacker sophistication tricks, just solid investigation logic.
Hunt A: Unusual Login Behavior
Look for privileged accounts logging in at strange times. See if the geography or device changed. Did MFA behavior shift? What happened on that host right after?
Hunt B: Rare Process Execution
Find processes that almost never run in your environment. Check the parent process—does it make sense? Is there an outbound connection happening right after?
Hunt C: Strange Outbound Connection Patterns
Watch for hosts connecting to destinations you’ve never seen before. Check if that destination has a bad reputation. Does it match any legitimate business tool you know about?
Hunt D: DNS Anomalies
Spot hosts or users asking for way more DNS queries than normal, or asking for domains nobody’s heard of. Where’s that traffic coming from? Can you see it in proxy or firewall logs?
Hunt E: Unexpected Admin Path Access
Track rare access to admin pages or sensitive routes. Who’s accessing them? From where? Is there failed auth noise or weird user-agent strings around it?
Hunt F: Privilege Changes
Watch for sudden spikes in role or group assignments. Is there a change ticket backing this up? Who approved it? What did the user do afterward?
All of these keep you focused on detection and response, not on understanding attacker tradecraft.
6) Threat hunting worksheet table (required artifact)
Use this worksheet structure for every hunt. It makes handoff, peer review, and detection conversion much easier.
| Hunt ID | Hypothesis | Data Sources | Time Window | Baseline Method | Key Fields | Query Notes | Pivots Run | Evidence Collected | Outcome | Detection Candidate | Owner | Next Review Date |
|---|---|---|---|---|---|---|---|---|---|---|---|---|
| HNT-YYYY-001 | Example: Rare privileged login pattern | Auth + endpoint + proxy | 14 days + current 24h | Same weekday/hour comparison | user, src_ip, host, auth_result | Saved search + filters used | User → host → process | Timestamped log bundle | Suspicious/Benign/Inconclusive | Rule idea summary | Analyst name | YYYY-MM-DD |
Minimum worksheet quality bar
- Hypothesis is explicit and testable
- Data sources are sufficient to disprove hypothesis
- Time window includes baseline and current period
- Outcome includes rationale, not just a label
- Detection candidate is written even for negative hunts (if data gap found)
7) Document Your Hunts Like They’re Code
If you don’t write it down, your hunt disappears. Treat hunt notes like engineering documentation that the whole team will use later.
Every Hunt Needs This Written Down
- Hypothesis: What you thought was happening and why you cared
- Query logic: In plain English, what you searched for
- How you set your baseline: What “normal” meant for this hunt
- Why you ruled out false positives: What benign explanations you considered
- Where your evidence came from: Links to dashboards, query IDs, case numbers
- What you concluded: What your confidence level is
- What’s next: Detection rule idea or telemetry gap you found
Confidence Levels (Keep It Simple)
| Level | What It Means | What You Do About It |
|---|---|---|
| Low | Something weird happened but you’re not sure | Ask for more data or watch longer before deciding |
| Medium | Multiple things point to the same suspicious behavior | Escalate to someone who can triage it properly |
| High | The evidence clearly shows malicious or policy-breaking activity | Open an incident and start responding |
8) Turn Your Hunts Into Permanent Detection Rules
The whole point of hunting is to find patterns that matter enough to automate.
How to Convert a Hunt Into a Detection
- Find the core pattern: What behavior actually separated the normal from the suspicious?
- Define your requirements: What fields do you need? How good do they need to be?
- Set your threshold: Based on your baseline, when should this alert?
- Add context: Tag by criticality, owner, environment—anything that helps triage
- Write the triage steps: What should an analyst check when this alert fires?
- Test it quietly first: Run it without alerting to see if the volume is sane
- Release it: Promote to production and commit to reviewing it regularly
Detection conversion table
| Hunt Outcome Type | Detection Action | KPI to Track |
|---|---|---|
| Confirmed suspicious behavior | Build new alert rule | Detection precision and incident conversion rate |
| Repeated benign pattern | Add suppression or context filter | False-positive reduction |
| Inconclusive due to missing fields | Create telemetry improvement task | Data quality completion rate |
| Rare but valid admin operation | Add approval/change-ticket correlation | Analyst triage time reduction |
9) Mistakes That Derail Hunts (And How to Avoid Them)
- Hunting without a real question: You just poke around hoping something jumps out. That wastes time.
- Bad field names: If your fields are all over the place, you can’t correlate anything.
- Ignoring who owns the system: You don’t know if something’s actually abnormal because you don’t know what normal looks like for that team.
- Time windows that don’t match: Comparing Monday to Saturday, or Tuesday morning to Friday evening. Your baseline becomes useless.
- Jumping to conclusions: One weird log entry is not proof of compromise. Get corroboration.
- Not turning wins into rules: You hunt, you find something, then it happens again next month. Why?
- No metrics tracking: You have no idea if hunting is actually making you safer.
Before You Hunt, Check This
- Write down your hypothesis before you touch the query tool
- Document what normal looks like before you call something abnormal
- For anything suspicious, dig at least one level deeper with a pivot
- When you wrap up, say what your confidence is and who owns the next step
- Create a ticket for any detection rule or data fix that came out of the hunt
10) Metrics That Actually Show Your Hunting Maturity
You get better at what you measure. Pick metrics that matter and tie them to real outcomes.
| Metric | Why It Tells You Something | What You Want to See |
|---|---|---|
| Hunts per month | Are analysts actually hunting, or just reacting to alerts? | Steady increase as you mature |
| New detections from hunts | Are hunts turning into better rules? | Increasing over time |
| False positives you eliminated | Is your tuning making rules better? | Reduction rate going up |
| Real incidents from hunting | Is hunting actually catching bad stuff? | Depends on your environment |
| Data gaps you fixed | Are you closing the holes hunting reveals? | Closure rate going up |
| Hours from hunt start to done | Are analysts getting faster? | Decreasing without sacrificing quality |
11) Get Started: A 4-Week Hunting Plan
Week 1: Make Sure Your Data Is Clean
- Check that auth, endpoint, and DNS/proxy logs are actually flowing in
- Make sure field names are consistent and timestamps are right
- Build two simple dashboards: one for auth, one for endpoint activity
You end this week with: A checklist of data quality issues and baseline snapshots
Week 2: Run Your First Hunts
- Do a hunt on login anomalies
- Do a hunt on weird process execution
- Use the worksheet format for both
- Show your team what you found
You end this week with: Two completed hunt worksheets with confidence levels
Week 3: Turn Findings Into Rules
- Pick one suspicious pattern you found and draft a detection rule for it
- Find one false positive pattern you saw and write a suppression for it
- Document the triage questions someone should ask when the rule fires
You end this week with: One detection draft and one tuning improvement you can implement
Week 4: Make It Operational
- Deploy your tuned detection and actually monitor it
- Run one more hunt, this time looking for data gaps
- Look at how many hunts you did, what you found, what comes next
You end this week with: Monthly hunt summary and a prioritized list of detections to build next
The real power of ELK threat hunting comes from doing it the same way every time: start with a question, gather consistent evidence, document everything, and turn what you learn into permanent rules.
Hunt operations worksheet for team consistency
| Workstream | Owner | First Action | Validation Signal |
|---|---|---|---|
| Hypothesis quality | Hunt lead | Require testable hunt question before querying | Fewer aimless hunts, clearer outcomes |
| Data reliability | SIEM/platform owner | Validate key fields and ingestion continuity | Reduced inconclusive hunts due to missing data |
| Evidence standards | Analysts | Enforce worksheet completion for all hunts | Better handoff and peer review quality |
| Detection conversion | Detection engineer | Track hunt-to-rule backlog with owners | More hunts converted into production detections |
Daily hunt discipline checklist
- Start with one explicit hypothesis and time window
- Record baseline method before interpreting anomalies
- Capture at least one pivot path per suspicious signal
- End each hunt with decision + next action owner
Hunt-to-detection handoff pack
| Artifact | Minimum Content | Consumer |
|---|---|---|
| Hunt summary | Hypothesis, data sources, confidence, outcome | SOC lead |
| Query logic notes | High-level logic and required fields | Detection engineering |
| Evidence bundle | Timestamped events and pivot trail | Incident responders |
| Improvement task list | New rules, suppressions, data-gap fixes | Platform + detection teams |
Quality checks
- Would another analyst reach the same conclusion from your worksheet?
- Are recommended detection changes specific and implementable?
- Are data gaps documented with actionable owners?
Your 90-Day Hunting Roadmap
Month 1: Get the Process Right
- Make sure everyone uses the same hunting worksheet
- Do one hunt a week on your biggest questions
- Track how many hunts you do, what outcome you get, how many become rules
Month 2: Fix the Data, Build the Rules
- Fill in the gaps in your field names and log sources
- Turn your best hunt findings into draft detection rules
- Start having the team review each hunt before you close it
Month 3: Operationalize and Report
- Deploy your new detections and watch how they perform
- See which new rules are generating signal, which are noisy
- Write up a summary of what you accomplished and where the gaps still are
| Thing to Track | Why It Matters |
|---|---|
| Hunts with full documentation | Shows the team is doing this right |
| New detections from hunts | Shows hunting is creating value |
| Hunts stuck because of missing data | Shows you what telemetry to invest in |
| Average time to finish a hunt | Shows if analysts are getting faster |
The magic happens when hunting consistently improves your detection rules, analysts make better decisions, and you steadily improve what you can see.
Hunt-to-detection pipeline (turn investigations into lasting coverage)
The highest-value hunts end with one of three outcomes: a new detection, a new control requirement, or a documented “not an issue” decision.
Hunt card template (repeatable)
| Field | What to capture |
|---|---|
| Hypothesis | What you believe is happening and why |
| Data prerequisites | Required logs, fields, and time range |
| Query approach | High-level logic (not just one query) |
| Validation | How you confirm true vs false positives |
| Outcome | Detection/control/documentation |
| Follow-ups | Owners and due dates |
Converting a hunt into a detection
- Extract the core signal that separates malicious from normal behavior.
- Identify the best data source (and what you need to onboard if it’s missing).
- Write triage steps that are deterministic and fast.
- Define safe suppressions (service accounts, known scanners, expected automation).
- Add a regression test: “this should still fire next month.”
Quality gates
| Gate | Pass condition |
|---|---|
| Data quality | Required fields present in > 95% of events |
| Analyst usability | Triage can be completed in < 15 minutes |
| Noise control | Alert volume is operationally sustainable |
| Documentation | Hunt card + reasoning are stored and searchable |
This keeps hunting professional: each hunt produces durable outcomes instead of one-off investigations.